
Currently, in the macroeconomic environment, we have a variety of indicators of economic progress, though they seem to operate in an ‘aggregate’ sense, reporting quantitative indications of progress or lack thereof, rather than making any real qualitative assessment about the economy, or even more detailed quantitative pictures that people can understand as it relates to their daily experience. What is needed seems to be a critical re-assessment of how we measure innovation and therefore better map our progress.
Data on the number of existing and new ‘jobs’ and unemployment data are long-term indicators as investment and activity do not directly translate into jobs gained immediately; furthermore, as mobility and multi-locational trends continue, jobs may not even be registered in the same place where the work occurs, especially with large corporations and multinationals. As mentioned earlier, much economic activity may not be captured in specific jobs data, but is supportive of the innovation economy as a whole. As companies disaggregate, and consulting/freelance networks increase, we will likely see a further diffusion of jobs per company decline, and the number of companies increasing, but which will be less geographically proximate. There are a number of additional measures being employed more recently to try and ‘read in’ the nuances within the economy, such as ‘quit rate’ to demonstrate people feeling ‘free’ to move on from existing jobs that may not fit, since there are fewer explanations to this transformative and unique period of slow economic growth.[1]
Looking at GDP per capita, perhaps the most appropriate measure of proportional activity in a place, which covers a broad variety of economic ‘inputs’ and ‘outputs’ and is generally a measure that lags actual activity. However, even after decades of use, the GDP measurement tool has not fully been calibrated with the innovation economy. In April 2013, an NPR report alerted the author that the GDP will be adjusted upward, to finally include R&D spending as a measure of inputs/investments into the economy. This is 2013! [2] Even world-leading economic analysis engines such as the International Monetary Fund (IMF) have released materials recently discussing the limitations of GDP and other macroeconomic measures, designed for keeping track of economies on an overall long-term growth trajectory, to show true activity in the economy.[3]
Our standard measure of innovation ‘productivity,’ has been based on ‘patents ‘ or licensing activity, but increasingly, these metrics not appear to measure the valuable part of innovation — the moment of knowledge transfer. Patenting is a legal process that fully documents the intellectual property of an invention, but many innovations that occur prior to an official Intellectual Property (IP) filing may emerge as unique products/services, and/or may catalyze new lines of inquiry that would result in a later time in a patent. Therefore patents and company formation seem to be just the tip of the iceberg, of what is actually happening, and do not reflect the environment in which the innovation is happening (the environment of business activity or physical context being perhaps more conducive to the innovation act).
As alternative measures, there are some additional ways to look at the innovation economy. The field of bibliometrics, which studies quantities and patterns in published papers, tends to gain an additional perspective of innovation economy activities, but publishing articles on innovation processes and products is not consistent across innovation industries. Examining articles published does show an increase in collaborative submissions over time, across jurisdictional boundaries, but makes that data hard to ‘match’ with other specific location-based data (such as tax filings or jobs). As defined by the private research group Science-Metrix in their study on collaboration potential, using MSA counties and cited/published paper data, a high collaboration rate is an indicator of a productive innovation culture. More importantly, the research showed that smaller MSAs (population) are keen to collaborate, but in proportion (i.e., scale) they are in fact significantly ‘collaborating’. Currently, the top 10 collaborative regions, when adjusted for size, are Durham, Baltimore, Seattle, Tucson, Washington, D.C., Boulder, New Haven, St. Louis, San Francisco, and San Diego,[4] incidentally all considered ‘secondary’ markets.
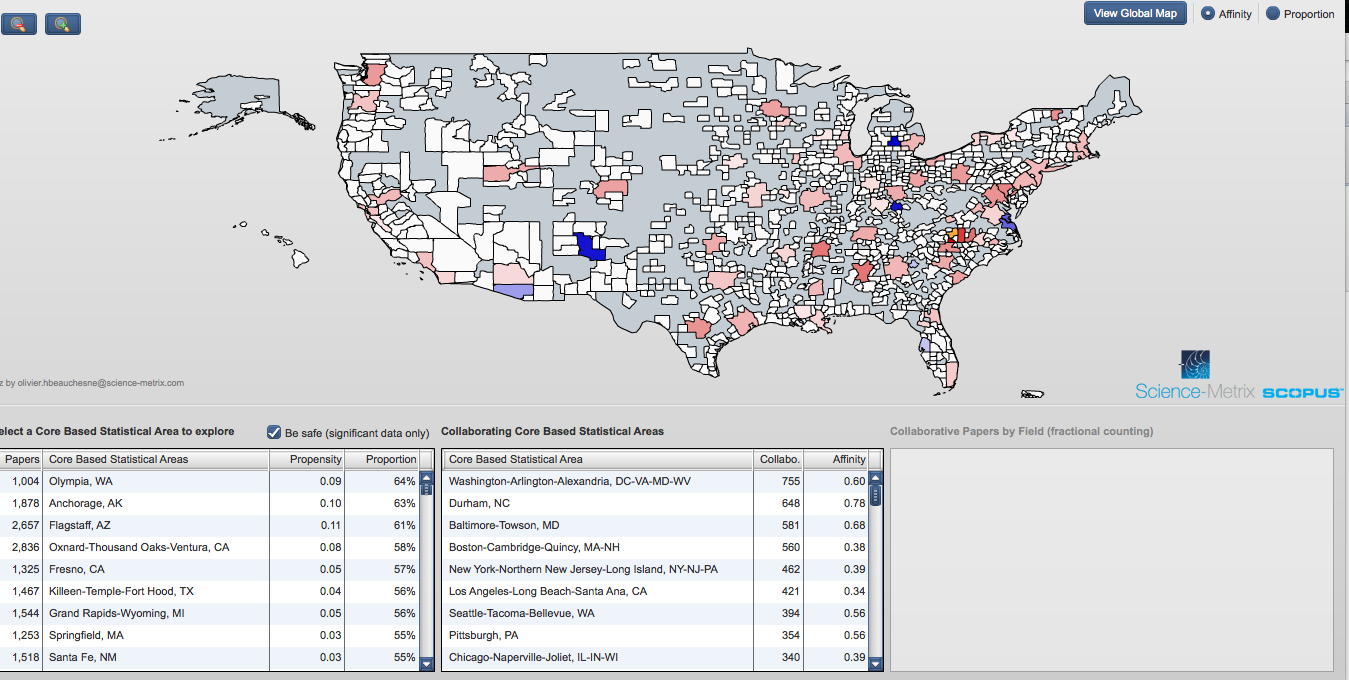 This MSA Explorer tool, created by Science-Matrix, is an interactive map that looks at the propensity to collaborate based on published papers with multiple authors. This map shows Winston Salem’s propensity to collaborate and with whom. http://www.science-metrix.com/MSAExplorer/
More importantly, some areas are more prone to collaboration and knowledge transfer activities. Many studies point to factors of geographic proximity, spontaneity, regional events, and social networks that promote regional scientific collaboration. In a similar vein, Sandy Pentland, MIT Media Lab professor, and many other leading scientists are studying how Big Data and the analytics of new technology ‘fingerprints’ could lead to reliable short-term (and quicker) reflections of economic activity. This author has always wanted to record daily life changes that, if tracked over time, might provide insight into the increase in ‘urban confidence’ that is a parallel sign of economic development: Increase of lawn games in public parks, length of lines waiting to get into popular restaurants, or increase of the act of ‘bumping into someone’ on the street that might lead to a new idea/collaboration or
[1] Apparently this is a rate that is more robust in a better economy. Currently at 1.7%, this rate has increased recently, which is a good sign, but has been higher in the past. Sabri Ben-Achour, “Why the Fed Wants You to Quit your Job” on Marketplace Public Radio. 2 May 2013, http://www.marketplace.org/topics/economy/why-fed-wants-you-quit-your-job
[2] Albert Sung, “Seeking Alpha: US Government Invents New Way of Calculating GDP”, website http://seekingalpha.com/article/1368001-u-s-government-invents-new-way-of-calculating-gdp
[3] Manik Shrestha and Marco Marini, Quarterly GDP Revisions in G20 Countries: Evidence from the 2008 Financial Crisis, IMF Working Paper, March 2013 , p 3. http://www.imf.org/external/pubs/ft/wp/2013/wp1360.pdf
[4] Beauchesne and Archambault, Conference Presentation by Science Metrix